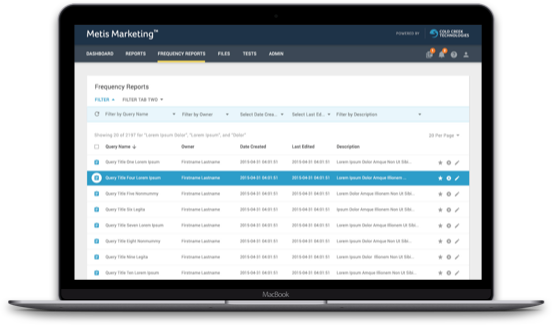
Complexity isn’t always an asset when you need to quickly and easily graph your data. See how Metis simplifies the process to save you time.
Have you ever tried to graph a trend with sparse data points? It’s frustrating and ineffective. To get the most out of charts, graphs, and other visuals, you need the full data set. Other vendors might tell you that only a few bits of data are sufficient to make slide deck. Not true. Back up your key points with solid data and watch your efforts pay off.
Having current marketing data at your fingertips is useful. You don’t always have time for deep analysis, especially during live campaigns. Sometimes you just need a quick visual for the campaign performance. You need to see the patterns in the data, not the individual numbers. A spreadsheet is too cumbersome and slow, and other vendors can’t handle the depth of granular data your analysis requires.
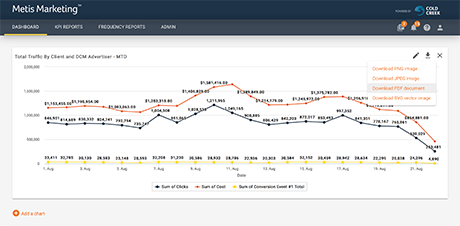
The Metis graphing wizard guides you through the entire graph creation process, making it easier than ever to visualize your reports. You don’t have to be a DBA or a business analyst to display your data effectively. Create clean, bold graphic representations without the hassles of coding or writing SQL queries. Our streamlined graphing wizard is layered over the most complete and granular marketing data available.
We show you complex data without a complicated interface. The controls and customizations are easy to find and use. No matter how you want your data displayed, a few clicks are all you need to get it done.
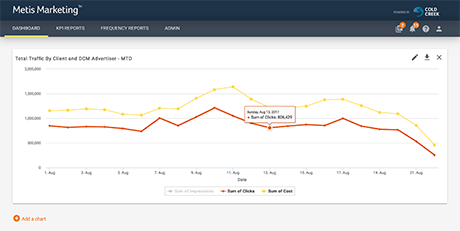
Every user can personalize their dashboard to show the information most important to them. Have a specific KPI you need to see daily? Run the wizard once to setup the graph, and it’s displayed every time you log in. Single setup, continuous data.
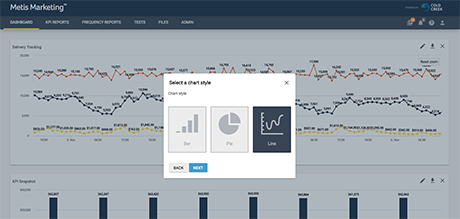
Don’t waste time digging up the latest data. When you embed a report graph into your dashboard, it’s updated every time you log in or whenever you refresh the page. Always stay up to date on your campaign with the newest numbers.
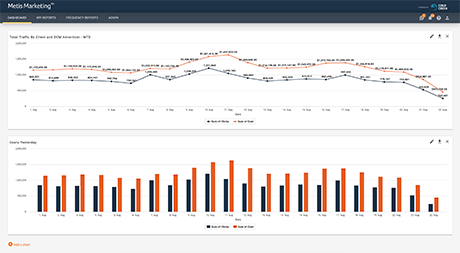
Want to see what’s going on with your campaign? Log in and see everything within seconds. Need to take it with you? With a few clicks, download your charts in PDF or common image file formats. Perfect for those times when you need grab-and-go graphics for meetings and presentations.
Take a deeper dive into your data for better analysis and results. Our Pinpoint Restatement and Data Triangulation technologies give you actionable feedback on demand.
Read MoreInstantly available reach, frequency, and overlap data for all your running campaigns. Understand the effectiveness of your campaigns and make adjustments at any time.
Read MoreAnalyzing big data shouldn’t mean days or weeks of stitching together files before the real work begins. Save time, money and resources by automating the process with our Data Formatting tool.
Read MoreRunning a split test should be quick and easy. But often your IT department and other red tape gets in the way. Testing and Traffic Routing lowers the barriers so you can get to work.
Read More